Funding discrepancies for municipalities in the NWT are the result of different gaps in service needs and the model is being updated to better allocate funds to where they are needed most.
That's the response from the Department of Municipal and Community Affairs (MACA) after a former Fort Simpson mayor sounded off on social media.
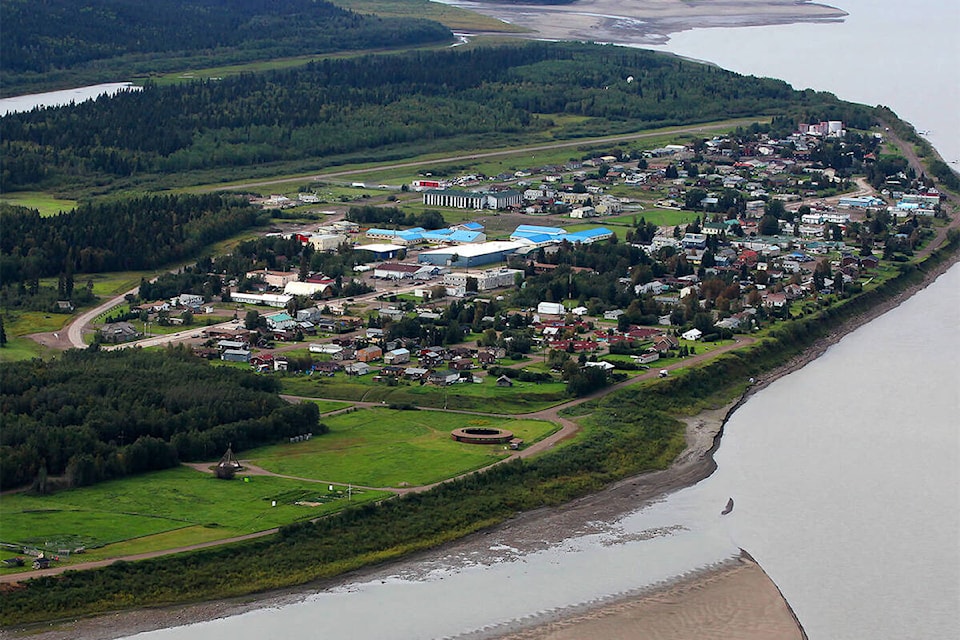
"In late November 2024, MACA announced increased community funding for regional centres, including Fort Simpson," wrote Sean Whelly. "However, the amount allocated to Fort Simpson was minimal in comparison to both historical funding needs and the amounts received by other communities.
"A decade ago, Fort Simpson was identified as having the largest annual funding shortfall SA����Ӱ�Ӵ�ý� estimated at $3 million SA����Ӱ�Ӵ�ý� out of a total $40 million shortfall across all NWT communities. Despite this history and our status as a regional centre, Fort Simpson has received the smallest share of the new funding. Notably, even Tuktoyaktuk received nearly three times the increase that Fort Simpson did. This raises an important question: Why has Fort Simpson been allocated such a disproportionately low increase in funding?"
A spokesperson for MACA said the funding model, known as the Community Allocation Model, was being updated to reflect community's service requirements and policies were updated on April 1, 2025.
Jay Boast, senior communications advisor for MACA, told NNSL the model, when implemented, would allot each community the same percentage of its service needs.
He added the changes were being put forward in a three-year transition.
"MACASA����Ӱ�Ӵ�ý�s focus is on aligning funding with each communitySA����Ӱ�Ӵ�ý�s actual service delivery needs SA����Ӱ�Ӵ�ý� and percentage of calculated costs is the most consistent way to reflect that across all communities," he said. "Because each community has different needs, infrastructure, and operating environments, their calculated costs SA����Ӱ�Ӵ�ý� and therefore their funding SA����Ӱ�Ӵ�ý� vary."
Boast said previously some municipalities were receiving more than 100 per cent of their service needs. The goal, he added, was to bring funding for those communities down to 100 per cent of services funded and re-allocate the remaining funding to underserved ones.
"As a result, some communities will see funding increases while others will see decreases until equitable distribution is achieved," he said. "It should be noted that MACASA����Ӱ�Ӵ�ý�s funding is intended to support community governments in the delivery of core programs and services, not to cover all of a community governmentSA����Ӱ�Ӵ�ý�s costs.
"Funding sustainable community government services is a shared responsibility across all levels of government. Community governments make their own decisions about what services to provide and how to fund additional costs beyond core services funding."
FACT FILE - Funding figures for Fort Simpson over the past 10 years.
Source: Department of Municipal and Community Affairs
|
Operations and Maintenance Funding |
Water and Sewer Funding |
Community Public Infrastructure Funding |
Canada Community Building Fund |
Total Community Government Funding |
|
| 2025-26 |
2,042,000 |
1,316,000 |
1,397,000 |
712,000 |
5,467,000 |
| 2024-25 |
2,032,000 |
1,346,000 |
1,333,000 |
653,000 |
5,364,000 |
| 2023-24 |
1,933,000 |
1,270,000 |
1,187,000 |
653,000 |
5,043,000 |
| 2022-23 |
1,858,000 |
1,270,000 |
1,187,000 |
613,000 |
4,928,000 |
| 2021-22 |
1,794,000 |
1,227,000 |
1,187,000 |
613,000 |
4,821,000 |
| 2020-21 |
1,794,000 |
1,227,000 |
1,187,000 |
1,148,000* |
5,356,000 |
| 2019-20 |
1,794,000 |
1,227,000 |
1,040,000 |
574,000 |
4,635,000 |
| 2018-19 |
1,736,000 |
1,205,000 |
1,040,000 |
1,148,000* |
5,129,000 |
| 2017-18 |
1,658,000 |
1,170,000 |
943,000 |
538,000 |
4,309,000 |
| 2016-17 |
1,606,000 |
1,129,000 |
943,000 |
538,000 |
4,216,000 |
| * includes top up funding |


